Live now: 8 wildfire cameras calibrated and measured every daySee the network
NewA line-of-sight audit of all 1,309 California fire cameras

Turn any fire lookout
into a calibrated sensor

Fuel Gauge is open-source computer vision that tells a camera exactly where it is looking. It solves the pose from the skyline alone, holds twenty years of footage on one view, and maps every pixel to a spot on the ground. No survey and no labels, and it runs on a laptop.

$ pip install "fuelgauge[geo,seg]"
LIVERed Mountain EastSan Diego County

Runs on open data from

PhenoCam NetworkHPWRENALERTCaliforniaCopernicus DEMESA WorldCoverNIFC Wildfire IncidentsGlobe-LFMCMODISMicrosoft Planetary Computer
The problem

Thousands of cameras watch for fire. None of them know what they are looking at.

California alone runs 1,309 wildfire cameras, each posting a frame a minute. But to the software behind them, a pixel is only a colour. It has no distance, no place on a map, and years of footage never line up because the mount drifts.

Fuel Gauge turns that colour into a measurement.

What the camera records
rgb(—)
What Fuel Gauge returns

    
0.04°median skyline error after solving a camera's pose, about one pixel
29,047photos locked onto fixed views across 21 cameras and 20 years
1,309fire cameras audited for line of sight across California
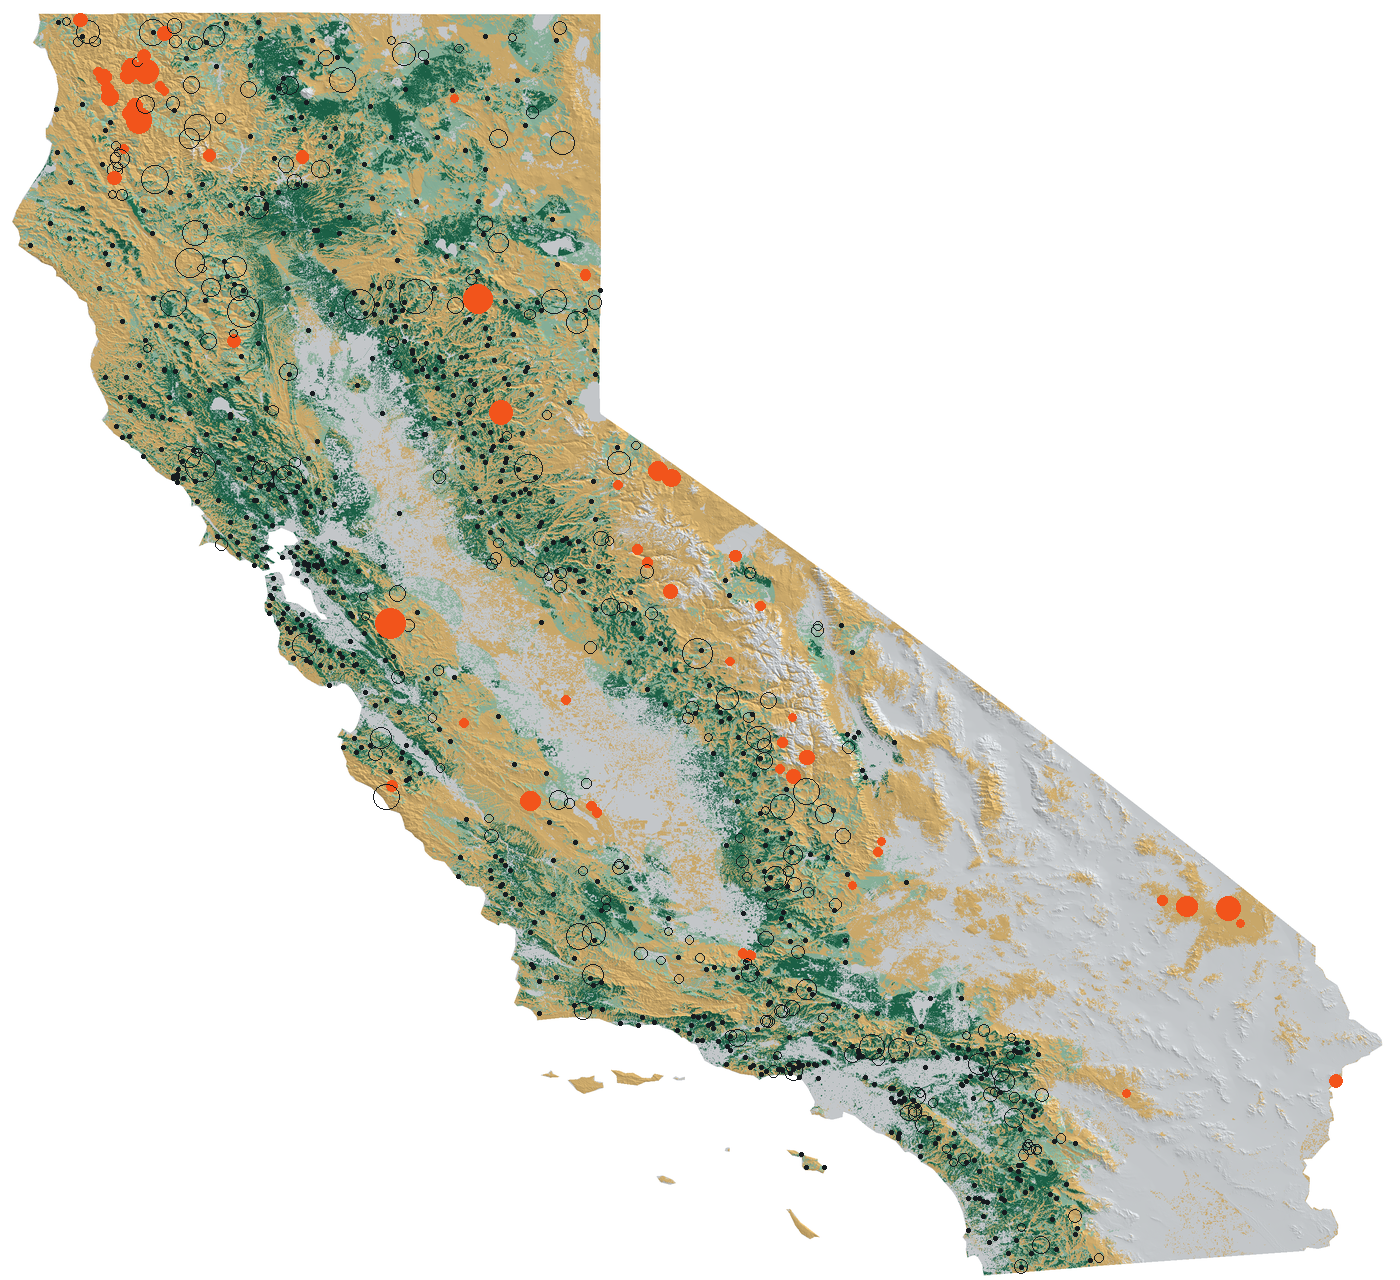
1.4Macres burned since 2020 by fires no camera could see start
How it works

Five steps from raw footage to a calibrated sensor

Each step is one command and one Python function. Run the whole pipeline or take the piece you need.

Step 1 of 5 Align

Twenty years of footage, one fixed view

Cameras drift a few pixels a month, get knocked by wind and crews, and get re-aimed or moved. Fuel Gauge locks every usable frame back onto one view, so a pixel means the same patch of hillside in 2004 and 2018.
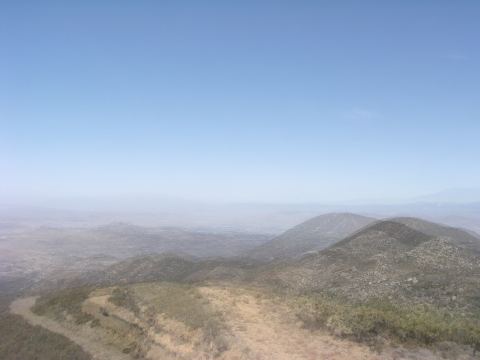
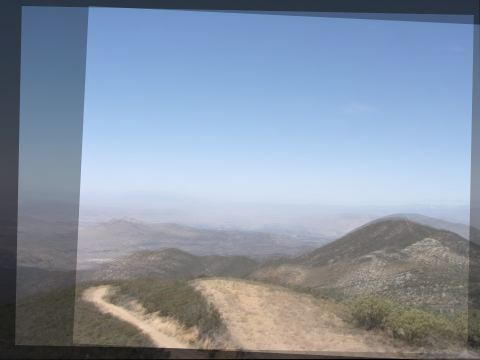
Three photos from 2007, 2008 and 2013 averaged as recorded: three hills and a smeared road The same three photos averaged after alignment: one sharp hill and road Before: averaged as recordedAfter Fuel Gauge
Under the hood
  • Frame screeningBrightness, Laplacian sharpness, contrast and clipping checks drop night, glare and blur before matching.
  • SIFT on CLAHE greyscaleContrast-limited histogram equalisation evens out season and time of day; matches pass Lowe's ratio test at 0.75.
  • 4-DOF similarity by RANSACShift, rotation and scale only. A full homography overfits to clouds and moving shadows.
  • Keyframe trackingFrames match recent keyframes, relocalise against older ones, and start a new stretch after four lost frames.
  • Loop closureStretches join through a maximum-inlier spanning tree over their clearest keyframes.
  • Relocations and bumpsA camera moved to a new mast becomes a second view; sustained shifts are logged as move dates.
fuelgauge register-archive photos/ out/ridge
Step 2 of 5 Calibrate

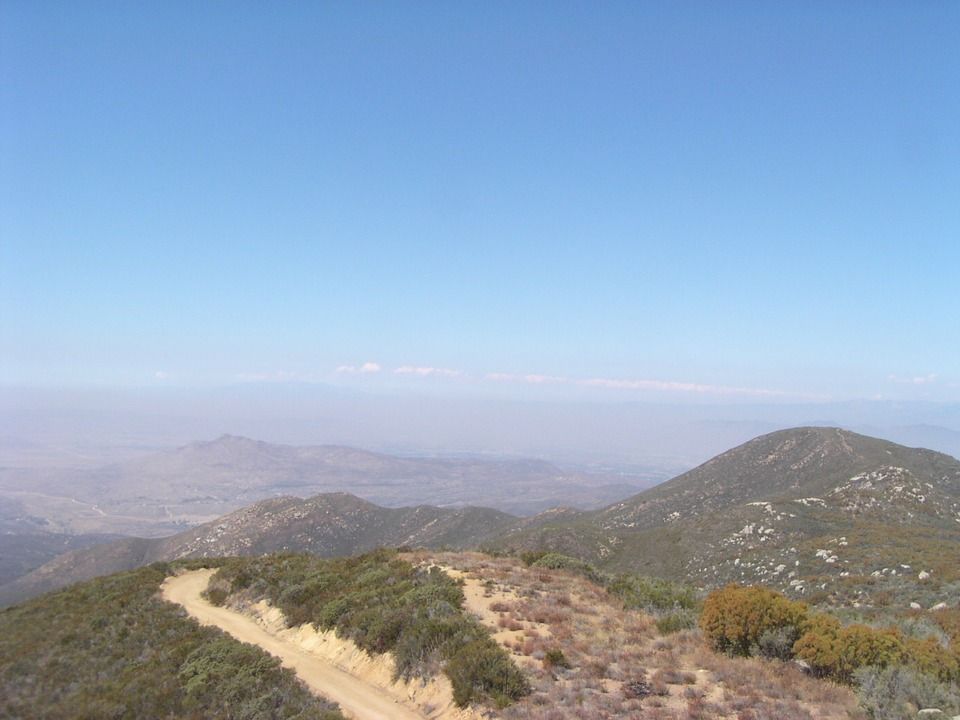
The skyline is a fingerprint. Fuel Gauge reads it.

Public cameras come with a location and nothing else. Fuel Gauge renders the skyline a 30 m terrain model predicts from that spot and fits heading, tilt, roll and lens until the two agree, with no survey and no ground control points.

Under the hood
  • Sky segmentationSegFormer-B2 (ADE20K) through ONNX Runtime on CPU; the skyline is the first non-sky row per column, snapped to the nearest strong edge.
  • Rendered terrain panoramaCopernicus 30 m elevation ray-marched along every bearing with earth curvature and refraction (k = 0.13).
  • Fisheye lens modelEquidistant projection with one radial term, θ = (r/f)(1 + k₁(r/f)²). Fire cameras are strongly barrel-distorted.
  • Robust pose fitBounded Powell search on a trimmed loss that ignores the worst 20% of columns: trees by the mast, low cloud.
  • Network lensOne field of view and distortion fitted jointly across all cameras of a model (101.15°, k₁ = 0.080 here).
fuelgauge calibrate ridge frame.jpg --lat 33.4008 --lon -117.1905 --elev 483 --yaw 90

Step 3 of 5 Map

Every pixel gets a place on the ground

With the pose solved, each pixel's line of sight is traced out until it hits the terrain. Every block in the frame gets a distance, coordinates, slope, aspect and land cover, ready to join with any map layer.

Tracing lines of sight

Under the hood
  • Back-projectionEach block's viewing ray is intersected with the rendered panorama; the first terrain cell it reaches is its ground point.
  • Terrain attributesSlope and aspect from elevation gradients; ESA WorldCover 10 m land cover at the ground point.
  • Usable-ground maskSky, the camera housing and blocks past the terrain model's reach are dropped before measuring.
ground = terrain.backproject(cam, pano)   # distance, lat, lon per block

Step 4 of 5 Measure

Colour you can trust across seasons

Raw camera colour is mostly haze, weather and sensor drift. Fuel Gauge keeps the clear days, finds the vegetation on its own, corrects colour against rock and soil in the same frame, and writes a daily record that only ever looks backward.

A ridge camera's anchor view with the automatically found vegetation and reference blocks marked
curedgreen flushcolour reference

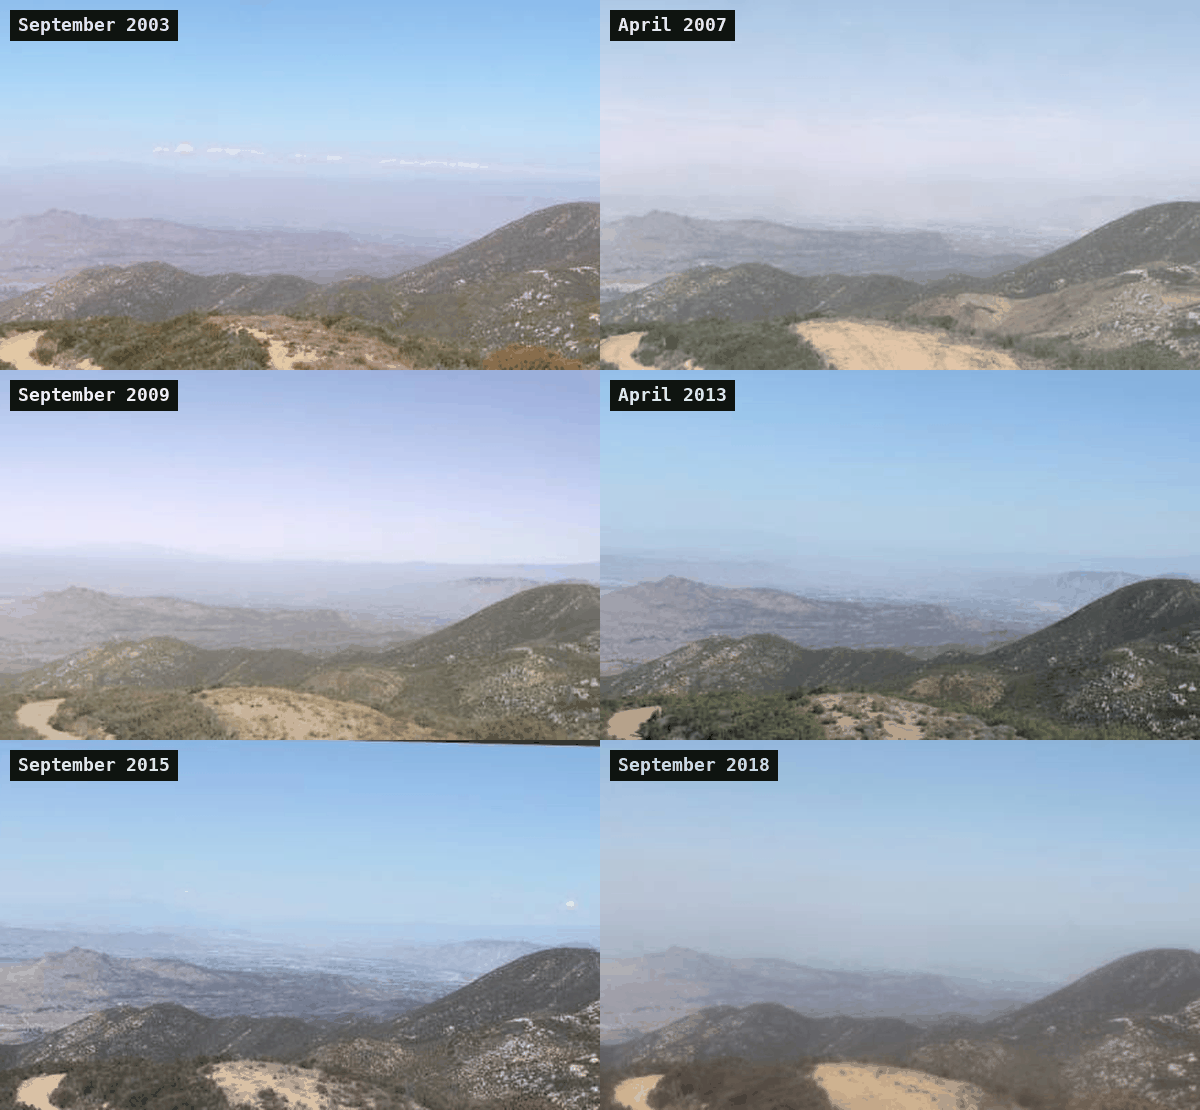
A Forest Service ridge camera, 2003 to 2018: green blocks were found automatically and measured; orange blocks anchor the colour correction. Right, the output: one row per year, one column per day.

Under the hood
  • Haze scoringSobel edge correlation with the anchor frame; a day is clear at 80% of its trailing 90-day norm.
  • Automatic regionsSegmentation vegetation labels plus a strong seasonal swing (5th to 95th percentile of weekly medians). No hand-drawn masks.
  • Drift-tracking white balanceA von Kries correction against blocks that stay flat all year, smoothed over 61 days so it follows the sensor, not snow.
  • IndicesGRVI and GCC per block; camera NDVI from near-infrared twins with exposure correction (Petach et al. 2014).
  • Causal smoothingWeekly 90th percentile then a 15-day mean, using only past data, so it is safe as a nowcast.
fuelgauge measure out/ridge   # _daily.csv + _regions.png

Step 5 of 5 Scale

See what a whole network sees, and where it is blind

Give it a list of camera sites. It traces terrain line of sight from every one, tests whether smoke rising anywhere would be in view, and ranks the hilltops that would close the biggest gaps.

California shaded by how many fire cameras can see each patch of wildland, with large fires since 2020 marked
Seen by 2+ camerasSeen by 1Unseen wildlandLargest unseen firesProposed sites
Under the hood
  • Radial viewshedsRays every 0.1° out to 30 km with curvature and refraction; a sample is visible when it beats every elevation angle before it.
  • Smoke line of sightWould a column 100 or 300 m above a point rise into view? That is how a lookout spots a fire before its base is visible.
  • Greedy sitingHilltop candidates in every 6 km square; each round takes the one that adds the most unseen ground, counted once.
fuelgauge viewshed cameras.csv coverage.tif
fuelgauge site cameras.csv --k 10
Results

Pointed at real cameras, it found things nobody had measured

Every result was produced end to end by the pipeline on public data. Each one has its own interactive page.

Running right now

A live, calibrated fire-camera network

Eight HPWREN cameras in Southern California, calibrated from their skylines. These frames come straight from the cameras and refresh every minute. Every morning a GitHub Action measures each ground block and publishes which slopes are drying fastest.

California time--:--
Get started

From a folder of photos to a calibrated record in one command

Python 3.10 or newer. CPU only. Photo dates are read from file names or EXIF, so most archives work as they are.

~/cameras


Your cameras are already watching. Make them measure.