Research, built with the Fuel Gauge pipeline 2003–2026
What fire cameras can see, and what their photos can't
Thousands of cameras watch Western hillsides for wildfire smoke. This project ties them to the ground to measure what they can actually see, and tests whether the same photos can tell how dry the brush is.
Two answers. California's fire cameras see less than you'd think: 46% of the state's wildland is in line of sight of one, and 21% of the big fires since 2020 started where no camera could see even a 300 m smoke column. And a camera can't read fuel moisture from how green the brush looks. Across 21 cameras and 3,832 field samples, colour and near-infrared barely beat the calendar, and satellites do only a little better.
46% of California's wildland is in line of sight of an ALERTCalifornia camera and 20% of two. Of 277 fires over 1,000 acres since 2020, 21% started where no camera could see a 300 m smoke column; together they burned 1.4 million acres. Looking back, ten well-placed new sites would have seen 88% of the acres burned by fires no camera could see.
A colour-corrected camera beats the calendar at 10 of 21 cameras, and pooled it has the same error as season alone. Adding near-infrared on 10 cameras didn't help: its anomaly correlation was 0.02, against 0.10 for colour on the same samples.
Greenness carries little of the signal. Satellite infrared at the sampling site does best and still reaches an anomaly correlation of only 0.31. Year-to-year swings in fuel moisture barely show in how green a hillside looks, from a ridge or from orbit.
Statewide–
What California's fire cameras can see
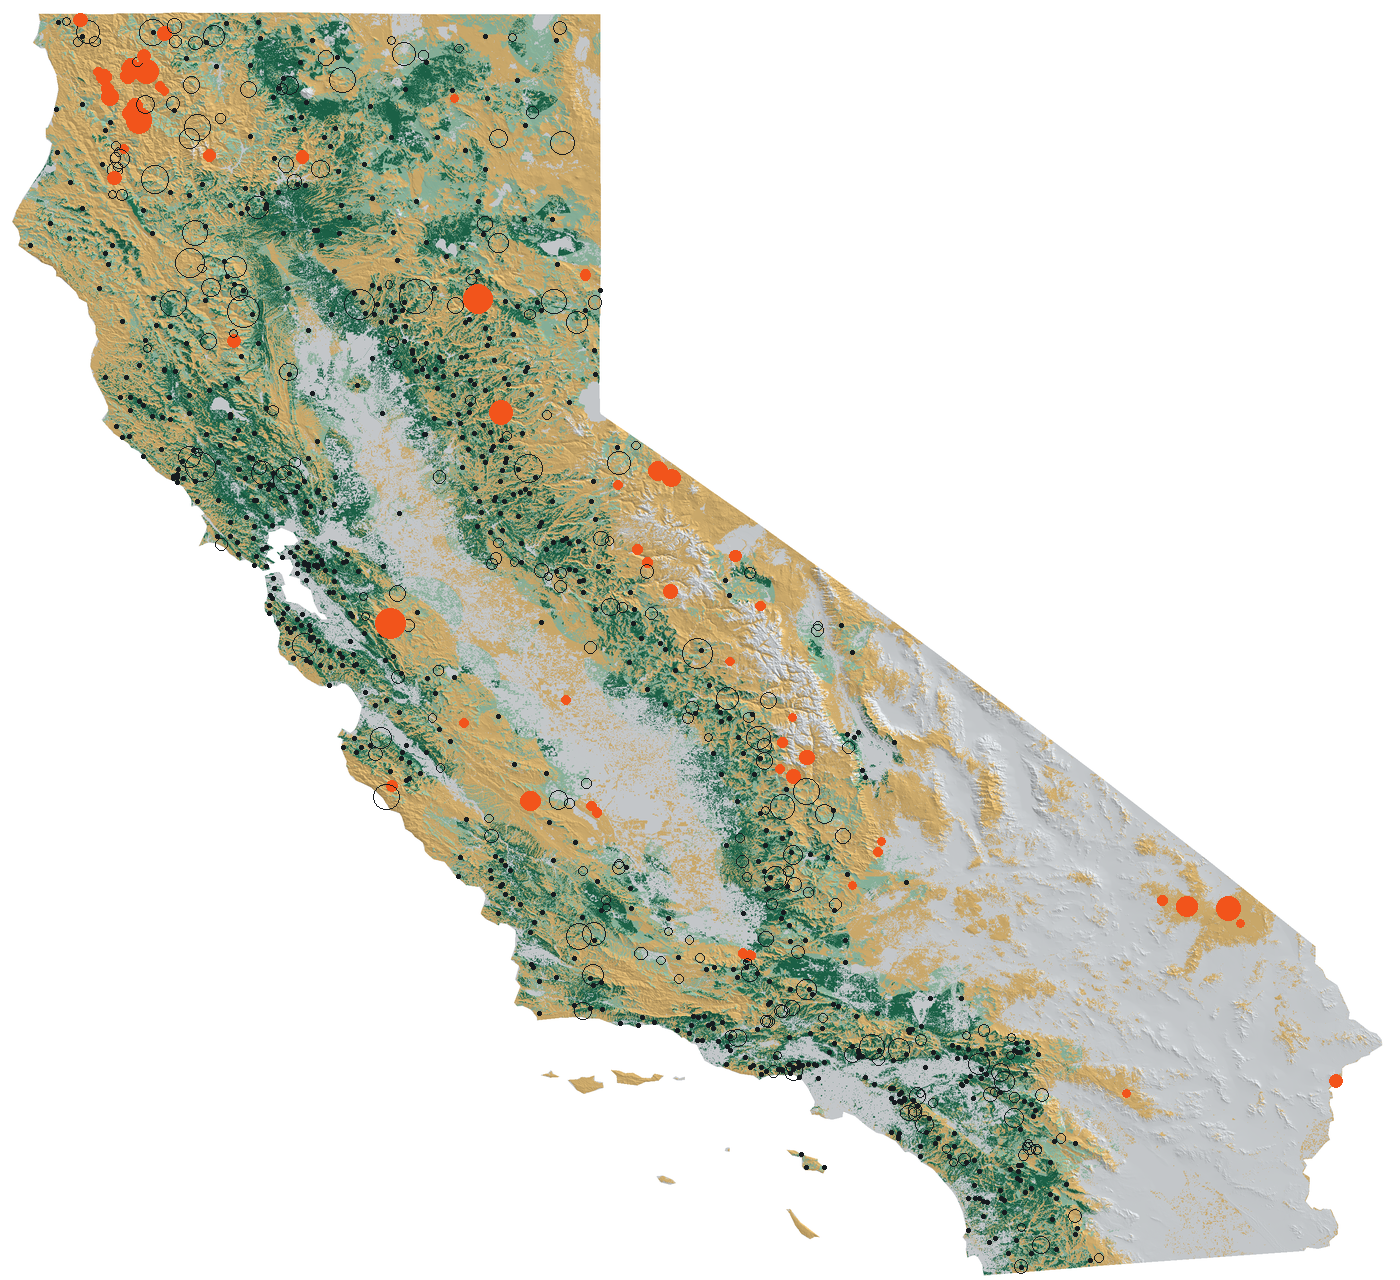
Where the big fires started, 2020–2025
| Fire size | Fires | Ground in view | 300 m smoke in view | Two cameras |
|---|
One ridge2003–2018
One hillside, fifteen years
A Forest Service camera above the San Jacinto Valley took a photo every day around noon from 2003 to 2018. Every photo here has been shifted, turned and scaled onto one shared view of the same slope, so the only thing that changes is the brush. Drag along the timeline to watch the chamise green up each spring and cure each fall.
The study–
Every camera with field samples nearby
Change in error against season alone, held-out years
| Predictors (each added to a per-site seasonal baseline) | Cameras where it beats season alone | Median change in error | Median skill at unusual years (anomaly r) |
|---|
Adding near-infrared
| Predictors, on the samples where the camera had an infrared photo | Cameras where it beats season alone | Error (RMSE, points) | Change in error | Anomaly r |
|---|
Explore–
Pick a camera
| Predictors | Error (pts) | vs season | Anomaly r |
|---|
What the camera saw, every day
Each row is a year and each column a day. Colour is the colour-corrected greenness of the measured blocks (straw is cured, green is flush). Rings mark field samples; hover or tap for values.
Measured against estimated
Method
Why this is harder than it looks
A camera on a pole is not a scientific instrument. Over fifteen years it gets bumped, re-aimed, replaced and fogged in, and its colours drift. Most of the work went into making years of photos comparable.
Live network–
Today's fire cameras, tied to the ground
CodeMIT licence
Use it on your own cameras
Everything above runs on an open Python package. Point it at a folder of daily photos from any fixed camera and it hands back registered colour measurements you can trust across years; give it a location and it ties each pixel to the ground.
Methods and sources